
Updates
Plot announces $10 million in new funding to accelerate Social Video Intelligence for Marketing Teams
June 1, 2026
This is some text inside of a div block.
Stanley is dominating the 2026 water bottle conversation online, increasing its share of voice by 44% across TikTok and Instagram, according to social listening data from Plot. However, while Stanley led in mentions, it also received significantly higher negative sentiment compared to competitors like Owala, Hydro Flask, and Yeti, largely driven by price increase backlash. The report highlights how brands should analyze both share of voice and sentiment together to better understand consumer perception and cultural relevance in fast-moving trend categories.
.webp)
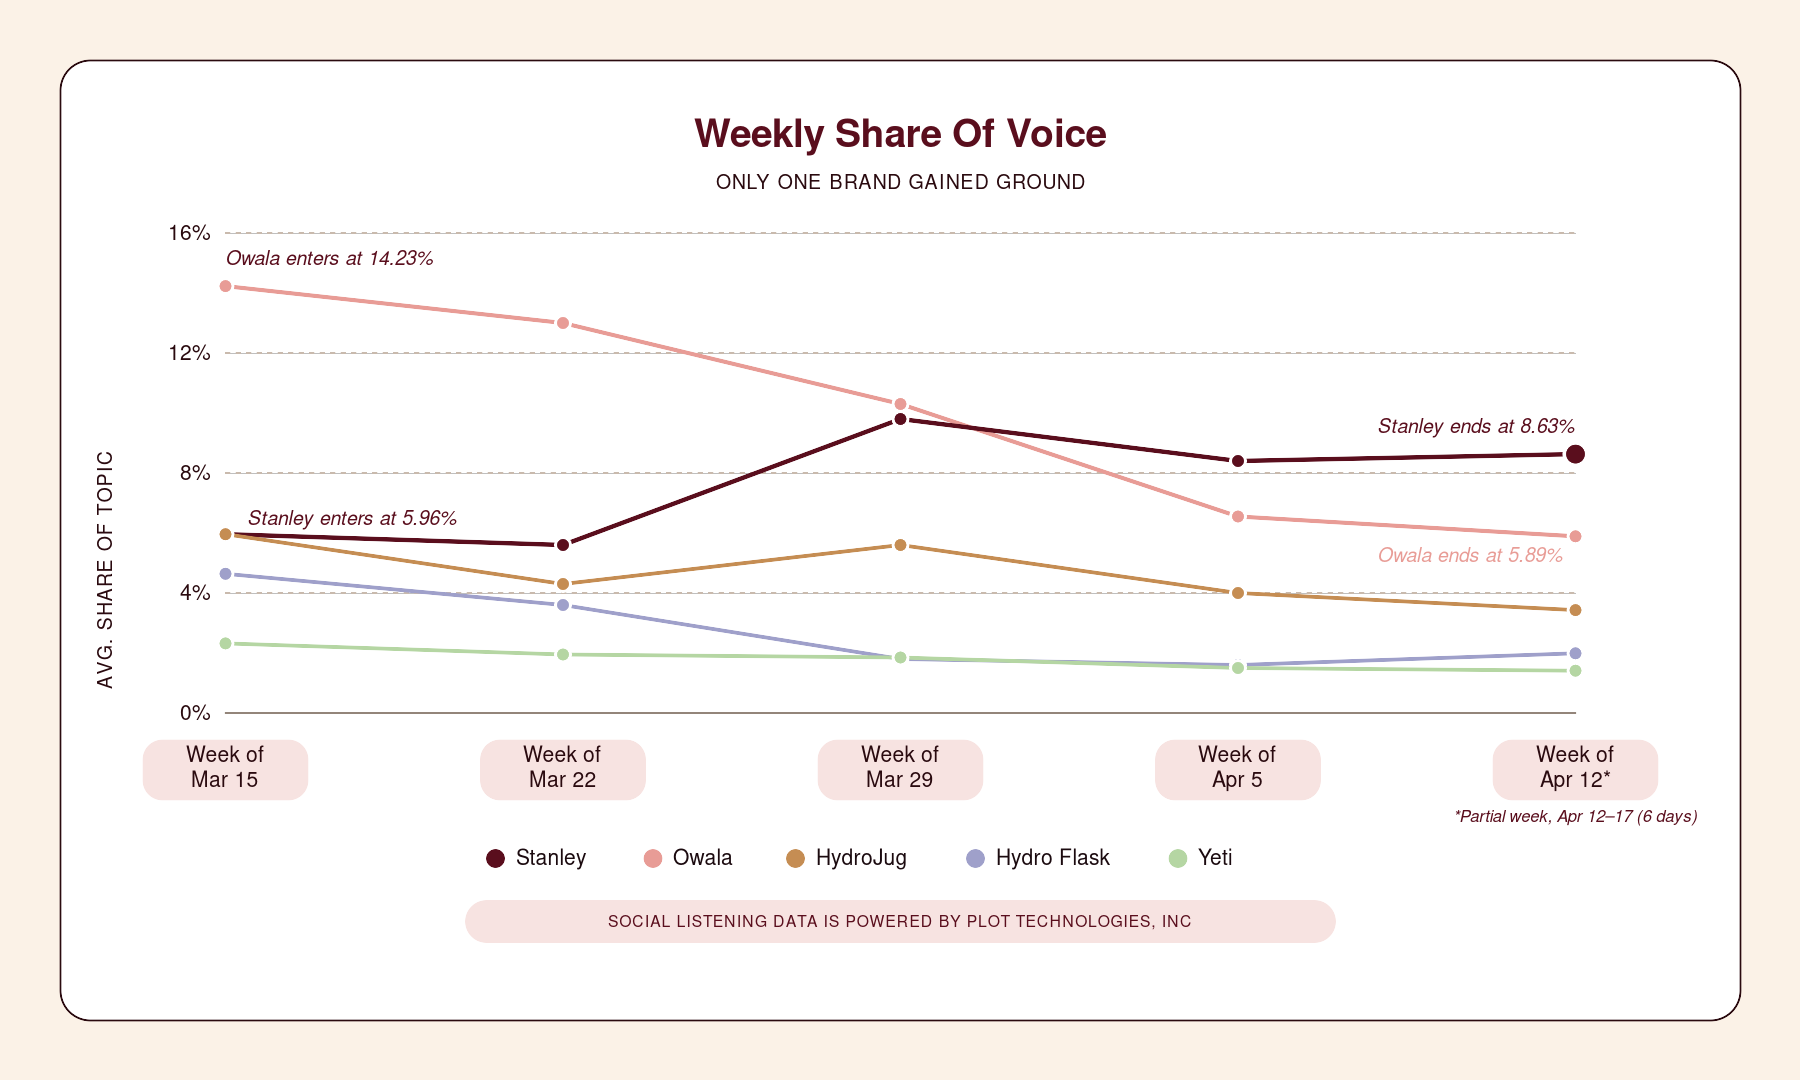
Stanley grew while every other tracked bottle shrank. Most dashboards would have stopped at that sentence. The full read takes another layer.
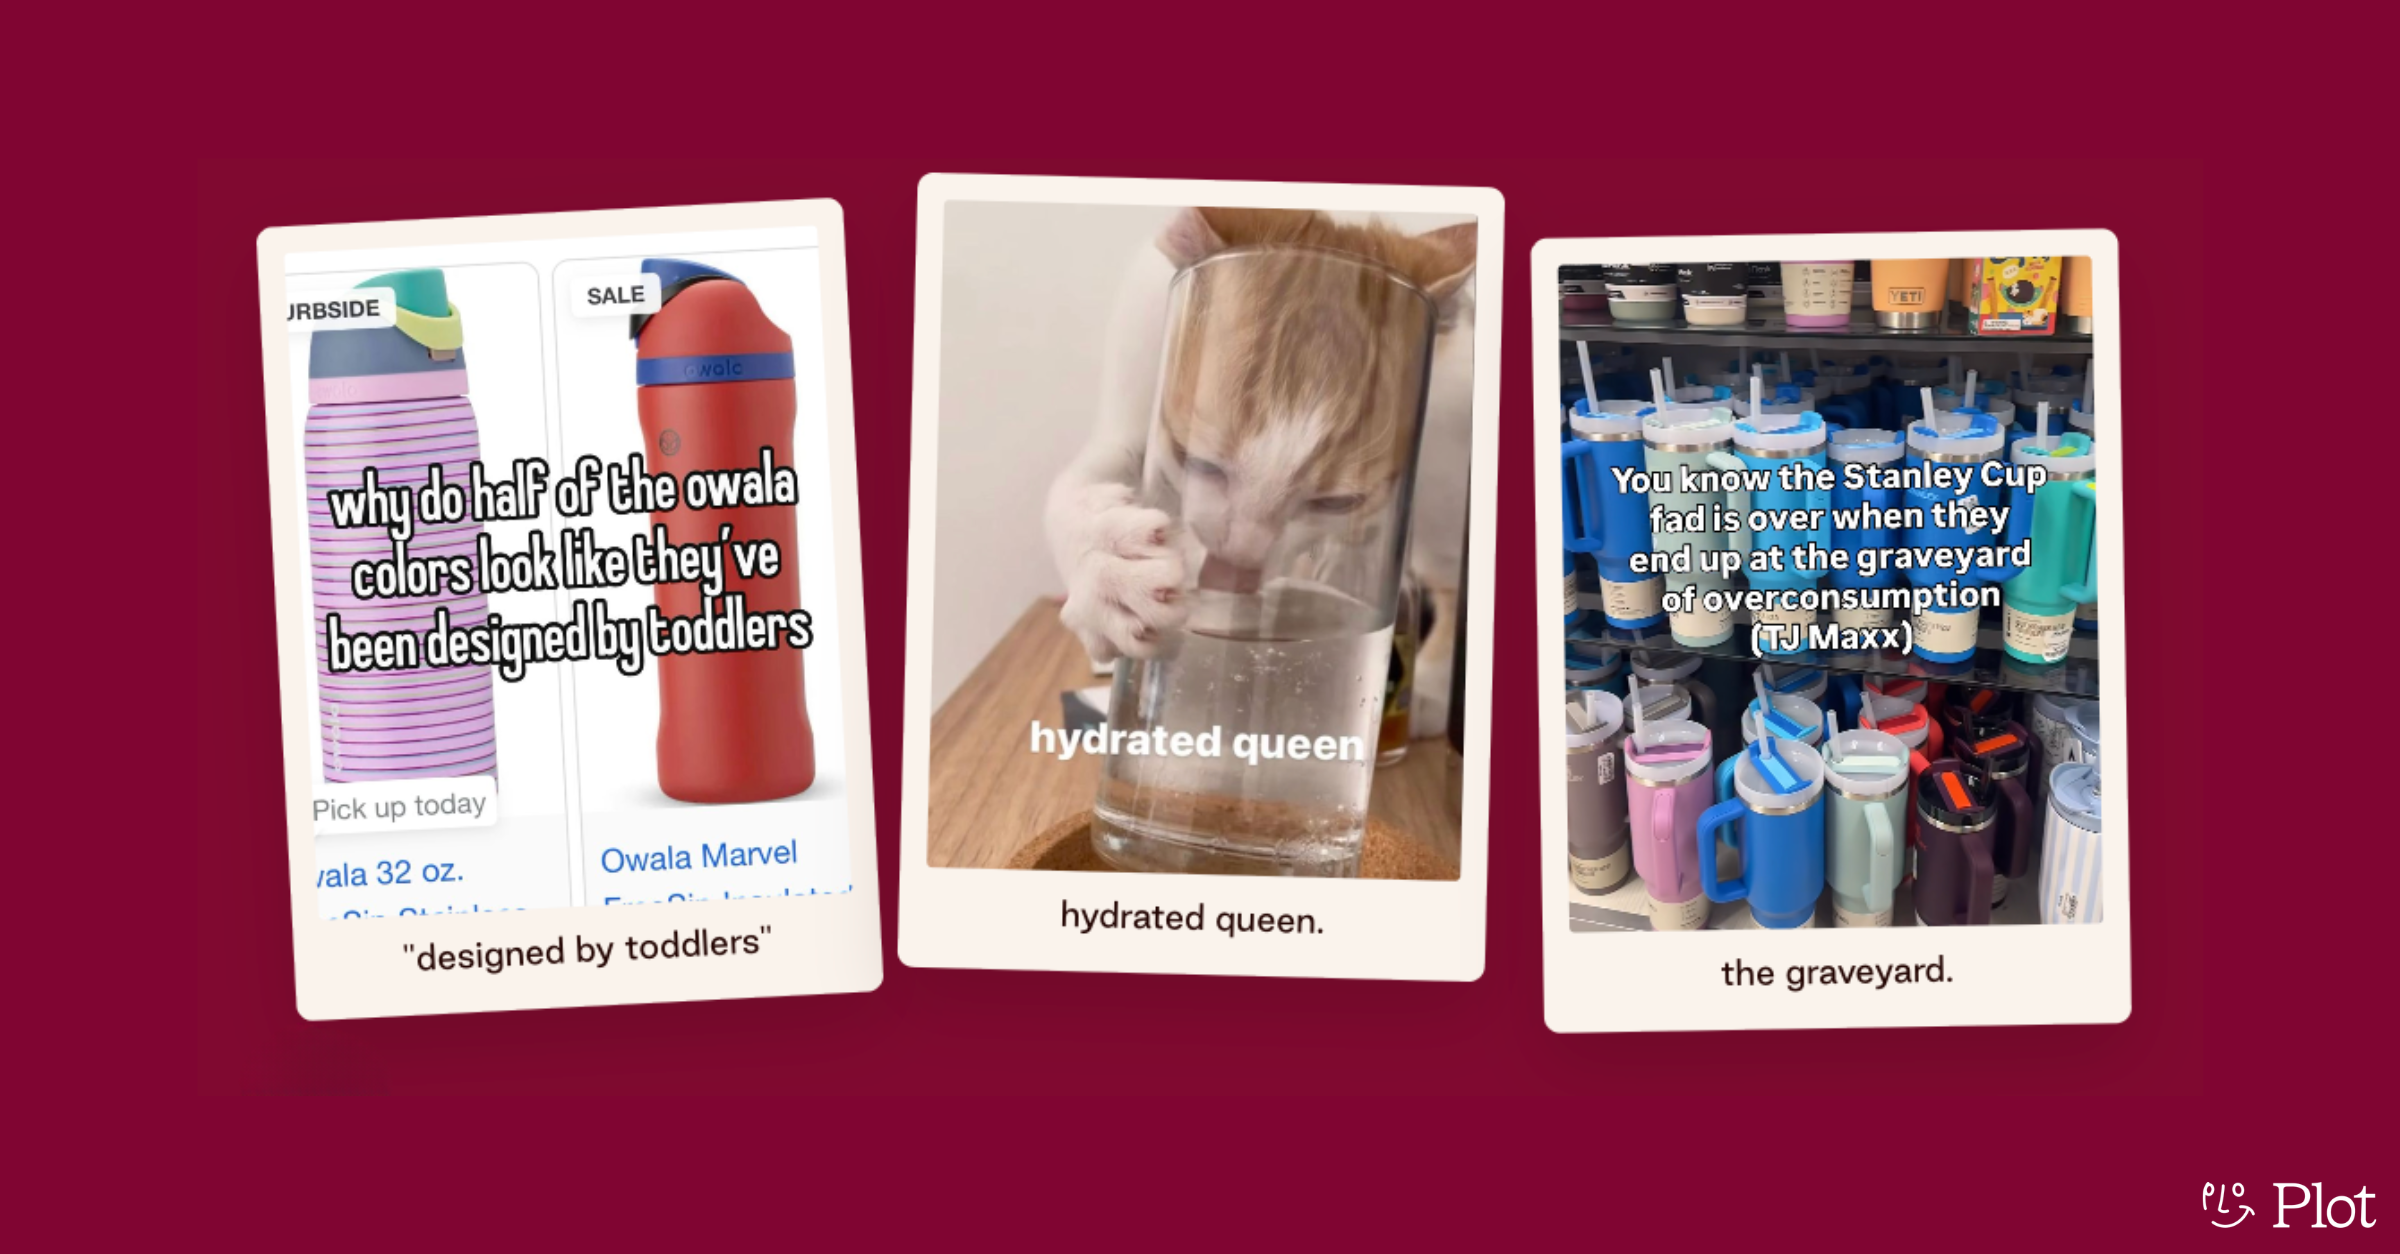
Every two or three years, the internet collectively agrees on a bottle. Hydro Flask was for the VSCO girls. Stanley took the oversized tumbler from "thing you bring to a job site" to "thing you bring to brunch." Owala has spent the last 18 months running drop logic — colorway, sellout, restock, repeat. Nalgene has been doing exactly the same thing since 1949 and shows no interest in being part of any of this.
The current cycle is moving fast. Plot tracked TikTok and Instagram posts in the water-bottle category from March 15 to April 17. The conversation more than quadrupled, from 1,293 posts in week one to 5,330 in the final week. One brand grew faster than the conversation, but not for the reasons they might’ve expected.
Most social listening tools will tell you when a brand's mentions spike, slap a sentiment score next to it, and call it a day. In a fast-moving cultural category, that approach isn’t going to give you the full picture.
Using Plot we found a pretty dominating pattern in share-of-voice across water bottle brands. Stanley's share of the water-bottle conversation climbed from 5.96% to 8.63% across the five-week window — a 44% lift on its share of the category, with raw weekly post volume jumping from 77 to 460. Every other tracked brand lost share, even when absolute post counts grew. The conversation grew faster than they did.
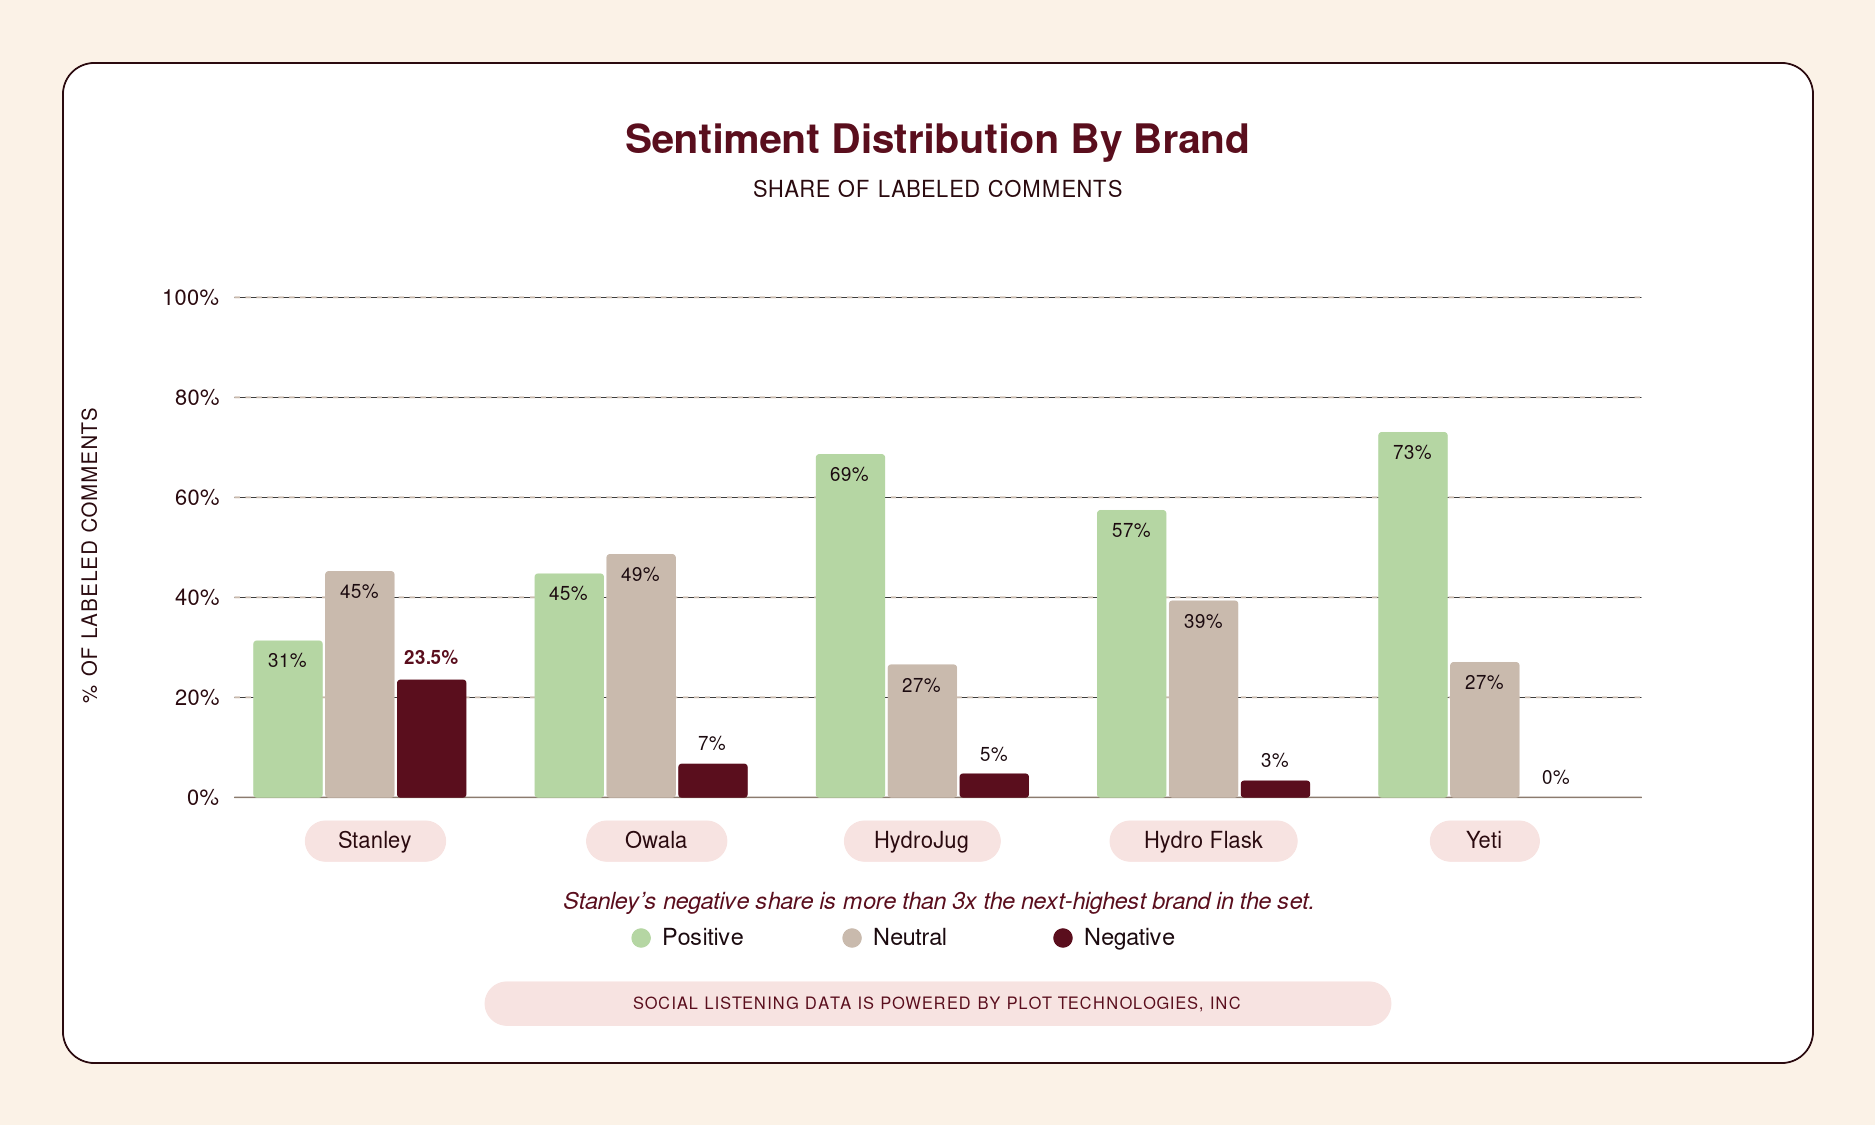
While their share of voice was significant, Stanley’s sentiment skewed far more negative than any other brand. We also used Plot to analyze sentiment across audio and visual queues for water bottle brands and saw that 23.5% of Stanley mentions were perceived to be negative, more than three times the share of within brand negative mentions for Hydro Flask, the brand with the next-highest total mention volume. Owala saw only 7% of its comments flag negative. Yeti, Hydro Flask, and HydroJug all came in under 5%.
The Stanley posts powering the positive share varied: exclusive color drops for Target, Mother's Day gifting bundles, a Starbucks collab, spring-drop releases, a viral car-fire moment.
The negative sentiment? Primarily about wariness on price. At the end of 2025, Stanley’s tumblers raised in price by five dollars. They also increased their shipping rate from six dollars to ten dollars. Based on what we observed, we think this be why we saw so many people are putting them on blast. Under one Stanley review on TikTok, two top comments captured both reactions: "it's soooo cute but $55 for a 16oz bottle is actually insane" (24 likes) and "sadly that is a Stanley that I would actually buy" (57 likes). Their conversation was mixed. And that’s what’s driving their share of voice — all press is good press?
Plot’s comment analysis takes us even further into the story.
We pulled the most-used words from comments about each brand's during the analyzed period. Five of the six tracked clusters look nearly identical: love, need, cute, shop, spring, where, restock. The exact language of trend. However, with Stanley’s recent price increase.
Nalgene breaks from that pattern entirely. Its top words: backpacking, tent, weight, gear, pack. Nalgene is an outlier by choice. They’re not trying to ride any trends. Holding that lane is a deliberate position, and a useful reminder that the it-bottle conversation is opt-in.
Three places to start when analyzing share of voice for your own brand:
Run share of voice and sentiment on the same data set. Share of voice on its own is the easiest metric to celebrate. It's also the one that missed Stanley's actual position in this window. Assessing both metrics together, would have surfaced the contested-object pattern weeks earlier.
Read the comments about your brand. Assume some of the richest sentiment data lives in the comments. To truly understand your audience you need to analyze video, captions, and comments.
Watch the gap between volume and love. Engagement rate, mention count, and sentiment data together provide the full picture for share of voice that you can actually action on.
.webp)